Category:
User Interface (UI) Design
Client:
Healthcare Center
Used Tools:
Power BI, Excel
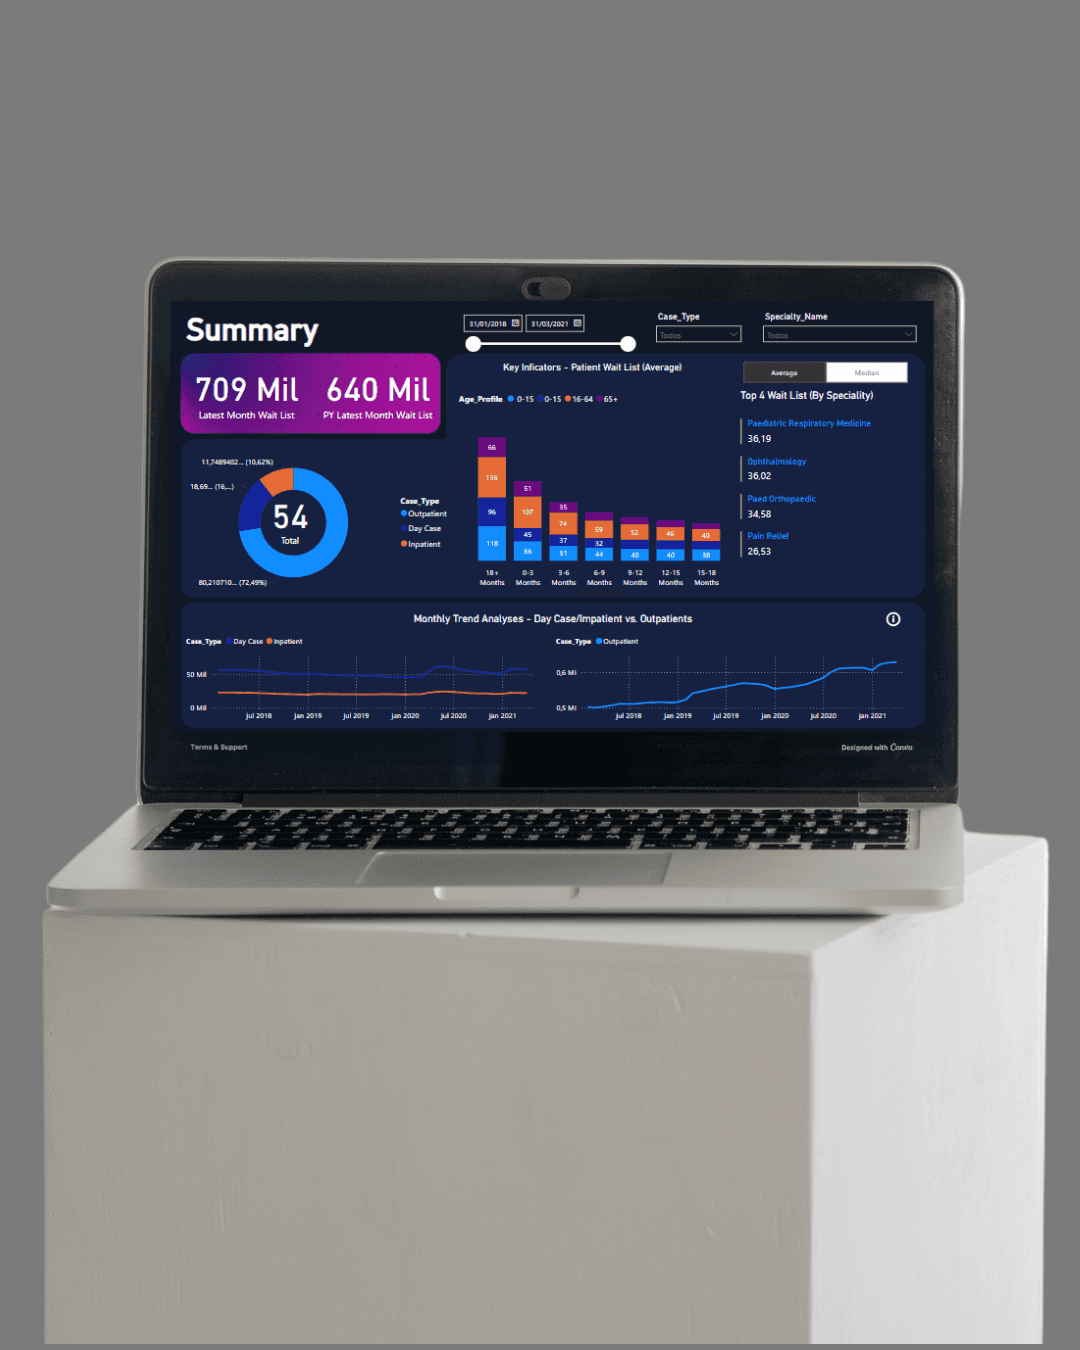
This dashboard was developed using Power BI and data extracted from Excel spreadsheets. It provides a comprehensive overview of healthcare service demand, with key indicators including the total number of outpatient, inpatient, and day care cases. The report also features monthly comparisons, analysis by age groups, and insights into the most sought-after medical specialties.
Additional breakdowns include detailed patient demographics and waitlist performance, helping stakeholders better understand trends and support data-driven decision-making in healthcare operations.
Click here and see more details